
Introduction
Modern applications are complex, distributed, and often span multiple services. Monitoring and debugging such systems can be challenging without the right tools. This is where OpenTelemetry comes into play—a powerful open-source framework for observability, enabling developers to collect, process, and export telemetry data (metrics, logs, and traces).
In this article, we’ll explore OpenTelemetry in Node.js, understand why it’s essential, and walk through a step-by-step implementation to instrument a Node.js application. By the end, you’ll have a fully functional OpenTelemetry setup, complete with code snippets, a full implementation example, and real-world use cases.
What is OpenTelemetry in Node.js?
OpenTelemetry (OTel) is a CNCF (Cloud Native Computing Foundation) project that provides vendor-agnostic APIs, SDKs, and tools for instrumenting, generating, collecting, and exporting telemetry data. It supports three primary types of telemetry:
Traces – Records of requests as they propagate through services.
Metrics – Quantitative measurements like CPU usage, memory, request rates.
Logs – Structured or unstructured textual records of events.
In Node.js, OpenTelemetry helps track application performance, detect bottlenecks, and debug issues across microservices.
The Ecosystem and Community
Being an open-source project, OpenTelemetry has a growing community with frequent updates, new integrations, and contributions from developers across the globe. Companies like Google, Microsoft, and many others actively contribute to its development, which makes it a robust solution for real-world, production-grade observability.
Why Use OpenTelemetry in Node.js?
Addressing the Complexity of Distributed Systems
The inherent complexity of Node.js applications, especially those built with microservices, necessitates a robust method to monitor and troubleshoot performance issues. With OpenTelemetry, you can trace the lifecycle of a request through every microservice and pinpoint where delays or errors occur. This is particularly useful when your stack includes multiple asynchronous operations, where traditional logging might fail to offer context.
Enhanced Observability
Observability is not just about logging errors; it’s about understanding how your system behaves over time. By instrumenting your Node.js application with OpenTelemetry, you will be able to:
Identify performance bottlenecks: Find and fix latency issues faster.
Improve uptime and reliability: Quickly diagnose root causes of system failures.
Gain deeper insight into your code’s execution: Understand which parts of your application are performing optimally and which need optimization.
Track resource usage and capacity planning: Monitor how your application scales under load.
Integration with Popular Tools
OpenTelemetry is designed to export telemetry data to a variety of backend analysis and monitoring tools such as Jaeger, Zipkin, Prometheus, and many commercial offerings like New Relic and Datadog. This flexibility means you are not locked into a single vendor and can adapt as your observability needs evolve.
Standardized Instrumentation
One of the most significant advantages of using OpenTelemetry is its standardization. Before OpenTelemetry, developers had to rely on a plethora of monitoring solutions, each with its custom API and instrumentation approach. OpenTelemetry provides a common language for observability, making it easier to integrate multiple telemetry sources and maintain consistency across your application.
Cost and Development Time Efficiency
The automatic instrumentation provided by OpenTelemetry reduces the time and effort required to manually implement tracing and metrics. This not only speeds up your development cycles but also minimizes errors related to custom instrumentation, resulting in more robust monitoring solutions.
What We’ll Cover in This Article
Introduce and explain the concept of OpenTelemetry and its importance for Node.js applications.
Detail the prerequisites needed to follow the tutorial, including installing necessary packages and setting up a basic Node.js project.
Provide a step-by-step implementation with code segments, highlighting key concepts such as creating spans and exporting trace data.
Showcase the final code integration by presenting a complete, working example that you can use as a reference or starting point for your projects.
Discuss the results and potential use cases of OpenTelemetry in real-world Node.js applications.
Offer insights and concluding thoughts on the benefits and future developments in the field of observability.
Pre-requisites
Before diving in, ensure you have:
Basic Knowledge of Node.js:
Familiarity with JavaScript and Node.js concepts, including callbacks, promises, and asynchronous programming, will help you understand the flow of this implementation.Node.js Installed:
You can download and install Node.js from nodejs.org. While this tutorial is applicable to all recent versions, it’s recommended to use the latest LTS version for stability.Code Editor and Terminal:
Use a code editor (like Visual Studio Code, Sublime Text, or Atom) and have access to a terminal to run commands.NPM or Yarn:
Package management will be essential as we will install multiple libraries. The examples here use NPM.OpenTelemetry Knowledge:
While this guide includes introductory material on OpenTelemetry, some familiarity with distributed tracing and metrics concepts is beneficial.Backend for Telemetry Data:
For demonstration purposes, we’ll use a simplified console exporter. However, in a production environment, you may need to configure backends such as Jaeger, Zipkin, or Prometheus.
Install Jaeger locally via Docker:
docker run --rm -d -p 16686:16686 -p 14268:14268 jaegertracing/all-in-one:latestAccess Jaeger UI at: http://localhost:16686
Step-by-Step Implementation of OpenTelemetry in a Node.js App
In this section, we will build a simple Node.js application and instrument it with OpenTelemetry to capture tracing data. We’ll break down the implementation into manageable steps, providing code snippets along the way.
1. Setting Up Your Node.js Project
Let’s start by creating a new Node.js project and installing the necessary dependencies.
Initialize Your Project
Open your terminal and create a new directory for your project:
1. Setting Up Your Node.js Project
Let’s start by creating a new Node.js project and installing the necessary dependencies.
Initialize Your Project
Open your terminal and create a new directory for your project:
mkdir open-telemetry-node
cd open-telemetry-node
npm init -y
This command will create a package.json file with default settings.
Install Required Packages
For this tutorial, we need the core OpenTelemetry packages along with some instrumentation libraries for Node.js. Run the following command to install them:
npm install @opentelemetry/[email protected],
    @opentelemetry/[email protected],
    @opentelemetry/exporter-trace-otlp-http: 0.48.0,
    @opentelemetry/[email protected],
    @opentelemetry/[email protected],
    [email protected]
2. Configuring OpenTelemetry in Your Application
Create a new file called tracing.js at the root of your project. This file will initialize OpenTelemetry, set up the tracer provider, and configure the exporter.
tracing.js
// tracing.js
'use strict';
const { NodeSDK } = require('@opentelemetry/sdk-node');
const { getNodeAutoInstrumentations } = require('@opentelemetry/auto-instrumentations-node');
const { OTLPTraceExporter } = require('@opentelemetry/exporter-trace-otlp-http');
const { Resource } = require('@opentelemetry/resources');
const { SemanticResourceAttributes } = require('@opentelemetry/semantic-conventions');
const resource = new Resource({
    [SemanticResourceAttributes.SERVICE_NAME]: 'my-node-app',
});
const sdk = new NodeSDK({
    traceExporter: new OTLPTraceExporter({
        url: 'http://localhost:4318/v1/traces',
    }),
    resource,
    instrumentations: [getNodeAutoInstrumentations()],
});
try {
    sdk.start();
    console.log('Tracing initialized');
} catch (error) {
    console.error('Error initializing tracing', error);
}
process.on('SIGTERM', () => {
    sdk.shutdown()
        .then(() => console.log('Tracing shut down'))
        .catch((err) => console.error('Error shutting down tracing', err))
        .finally(() => process.exit(0));
});
This configuration sets up a basic environment to record and export trace data. In a development scenario, you might choose to use a console exporter or integrate with a more sophisticated backend.
3. Building an Example Express Application
// app.js
require('./tracing'); // MUST be first
const express = require('express');
const app = express();
const port = 3000;

app.get('/', async (req, res) => {
    let data = await getData();
    res.send(`Hello from OpenTelemetry Node.js App!<br><pre>${JSON.stringify(data, null, 2)}</pre>`);
});

async function getData() {
    try {
        const response = await axios.get('https://jsonplaceholder.typicode.com/todos/1');
        console.log('Data fetched:', response.data);
        return response.data;
    } catch (error) {
        console.error('Error fetching data:', error.message);
        return { error: error.message };
    }
}
app.listen(port, () => {
    console.log(`Server running at http://localhost:${port}`);
});
In this code, we require the tracing.js file at the top to ensure that OpenTelemetry is configured before any other module loads. Then, we create a basic Express server with one endpoint that starts and ends a span, simulating a traced HTTP request.
4. Running the Application and Observing Results
Before running the application, ensure that your telemetry backend (in this case, Jaeger) is running. You can run Jaeger locally via Docker:
docker run -d --name jaeger \
  -e COLLECTOR_ZIPKIN_HOST_PORT=:9411 \
  -p 5775:5775/udp \
  -p 6831:6831/udp \
  -p 6832:6832/udp \
  -p 5778:5778 \
  -p 16686:16686 \
  -p 14268:14268 \
  -p 14250:14250 \
  -p 9411:9411 \
  jaegertracing/all-in-one:1.41
Now, start your Node.js application:
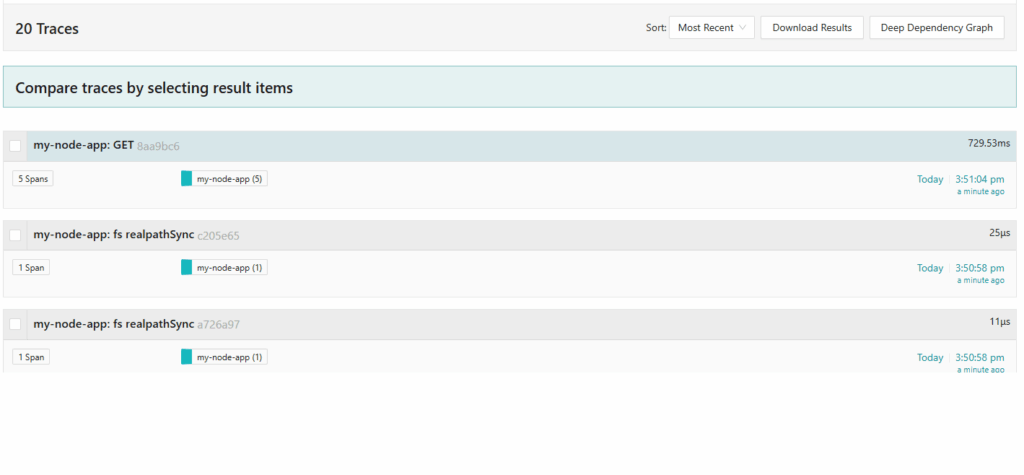
node app.jsWhen you navigate to http://localhost:3000 in your browser, the application will create a trace for the HTTP request. You should see logs in your terminal confirming that the OpenTelemetry tracing was initialized and the server is running. Then, you can open the Jaeger UI (typically available at http://localhost:16686) to view the traces and the various spans generated by your application.
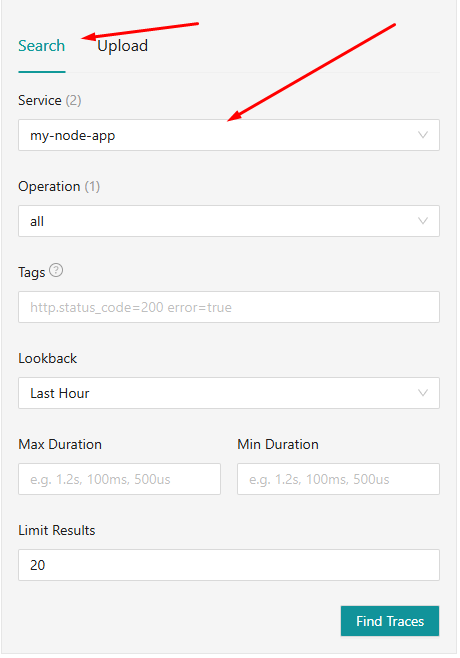
Open Jaeger UI
Go to: http://localhost:16686
1. In the top dropdown “Search” > “Service”, select my-node-app (or whatever name you set in SERVICE_NAME).
2. Click “Find Traces”
3. You’ll see recent traces!
4. Click one to explore spans, timings, and attributes.
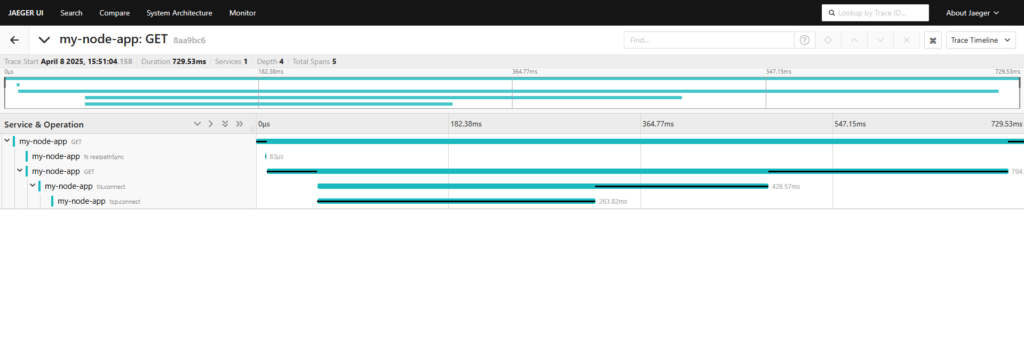
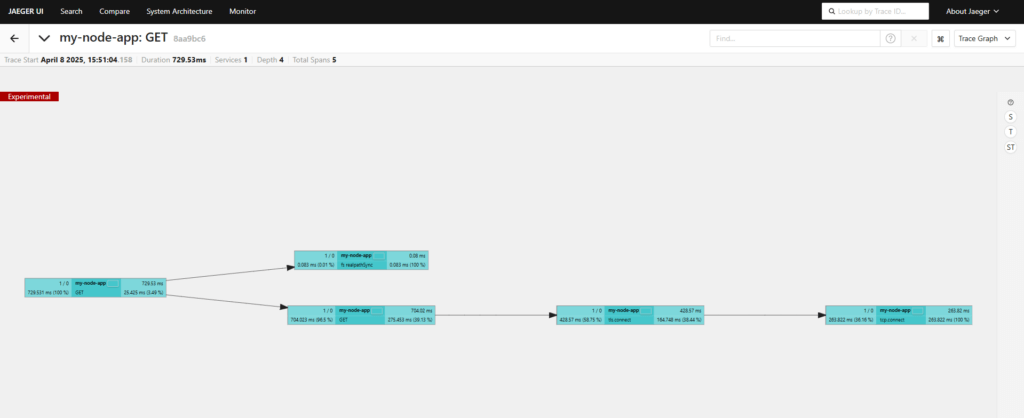
Interpreting the Results
Once you’ve run your application and performed some HTTP requests, you’ll see traces appear in your telemetry backend. Each request (span) will show:
Duration: How long it took to complete the request.
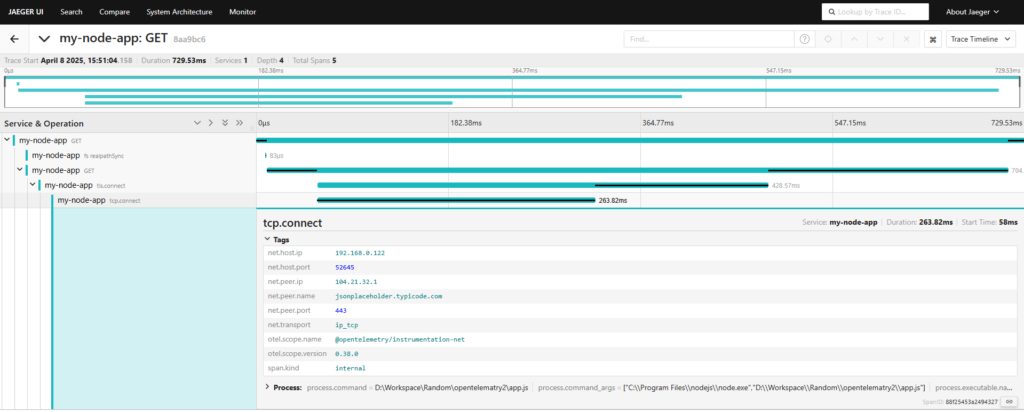
Attributes: Custom metadata, such as HTTP method, URL, and status codes (depending on what you configure in your spans).
Hierarchy of Spans: In more complex applications, you can see the parent-child relationships between spans that represent nested operations.
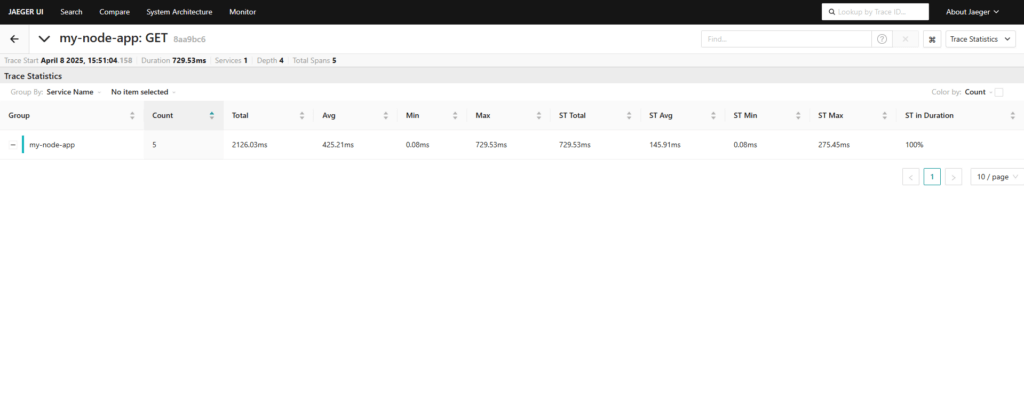
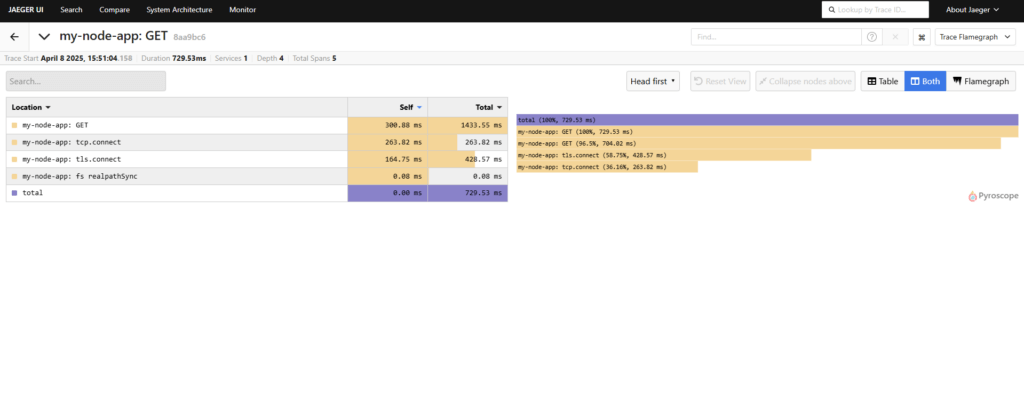
In the Jaeger UI, for example, you can drill down into a specific trace and view its spans along with latency details, network timings, and any additional context you have included. This information is vital for performance tuning and root-cause analysis.
Use Cases of OpenTelemetry in Node.js
As OpenTelemetry continues to mature, several real-world use cases have emerged, demonstrating its value in production environments. Let’s explore some of these use cases in the context of Node.js.
1. Distributed Tracing in Microservices Architecture
In a microservices environment, a client request might span multiple services. OpenTelemetry provides a consistent method to propagate trace context between services. This allows you to view the complete call path, identify where delays occur, and quickly spot faulty services. For example, in an e-commerce platform, you might trace a customer’s journey from placing an order to its eventual processing in multiple back-end services.
2. Performance Optimization and Bottleneck Analysis
Developers can use OpenTelemetry to capture metrics and traces that help identify performance bottlenecks. By examining the duration of each span, you can pinpoint slow components or third-party API calls that slow down the user experience. This data drives targeted optimizations and resource reallocation to improve overall application performance.
3. Error Detection and Debugging
When errors occur in distributed systems, the root cause is often difficult to isolate. With detailed tracing, you have a granular view of the error’s propagation path. You can set alerts and create dashboards monitoring error rates per service, making it easier to debug issues and prevent them from becoming widespread.
4. Capacity Planning and Scaling
Gathering telemetry data over time allows teams to forecast resource usage and plan capacity. Node.js applications, particularly those with dynamic traffic patterns, benefit greatly from tracing and metrics data that inform decisions on horizontal scaling, load balancing, or refactoring parts of the application that struggle under load.
5. Security Auditing and Compliance
Tracing and logging are not only useful for performance insights but also play a significant role in security audits and compliance reporting. OpenTelemetry makes it easier to monitor transactions across services and record data that can be used in regulatory audits. This is crucial for industries that need to demonstrate adherence to strict security standards.
Conclusion
In this article, we explored the fundamentals of OpenTelemetry in Node.js, diving into the reasons why observability is a crucial part of modern application development. We discussed how OpenTelemetry’s capabilities in distributed tracing and metrics collection can help you gain a deeper understanding of your application’s behavior, ultimately leading to performance improvements and enhanced reliability.
We walked through an end-to-end example that showed how to initialize and configure OpenTelemetry, instrument a simple Express application, and view the results using Jaeger. Through the full code listing, we provided a clear and practical reference for integrating OpenTelemetry into your own projects. Additionally, we discussed various use cases where OpenTelemetry can be leveraged, including microservices tracing, performance analysis, debugging, capacity planning, and security auditing.
Key Takeaways
Observability is vital: With systems growing in complexity, proper observability helps to diagnose and fix issues quickly.
OpenTelemetry provides a standardized approach: By unifying tracing, metrics, and context propagation, it simplifies instrumentation and reduces vendor lock-in.
Practical implementation in Node.js: The step-by-step example showed how to set up and instrument a Node.js application, allowing you to monitor operations and diagnose performance bottlenecks effectively.
Broad range of applications: OpenTelemetry can be used not only for debugging and performance tuning but also for security, compliance, and capacity planning.
For developers and teams looking to improve their observability strategy, OpenTelemetry offers a robust, vendor-neutral solution that integrates seamlessly into Node.js environments. By adopting these practices early, you can build more resilient, scalable, and manageable systems.
As you begin or continue your journey in observability, remember that open-source projects like OpenTelemetry are continuously evolving. Make sure to keep an eye on the latest releases and community contributions, as they offer new features, better integrations, and an ever-improving developer experience.
Thank you for following along with this comprehensive guide on OpenTelemetry in Node.js. We hope that the information and practical examples provided here empower you to take control of your application’s observability, helping you build better software faster.
Boost Your Node.js Projects with The Right Software
At The Right Software, we specialize in building scalable and observable applications using the latest technologies like OpenTelemetry and Node.js. Our experienced Node.js developers can help you integrate full observability into your applications—covering traces, metrics, and logs—so you can monitor, debug, and optimize like never before.
Whether you’re starting a new project or need help improving your existing monitoring setup, our developers are ready to assist.